 |
|
|
| |
Viral Load is Best Predictor of AIDS & Death In Long Term
|
| |
| |
----but in short term, perhaps over the course of 1-2 years slope of CD4 Decline predicts AIDS
Reported by Jules Levin
CROI, Feb 2007, Los Angeles
SUMMARY BY MELLORS:
--HIV RNA at baseline explains very little of the variability in CD4 slope (3%)
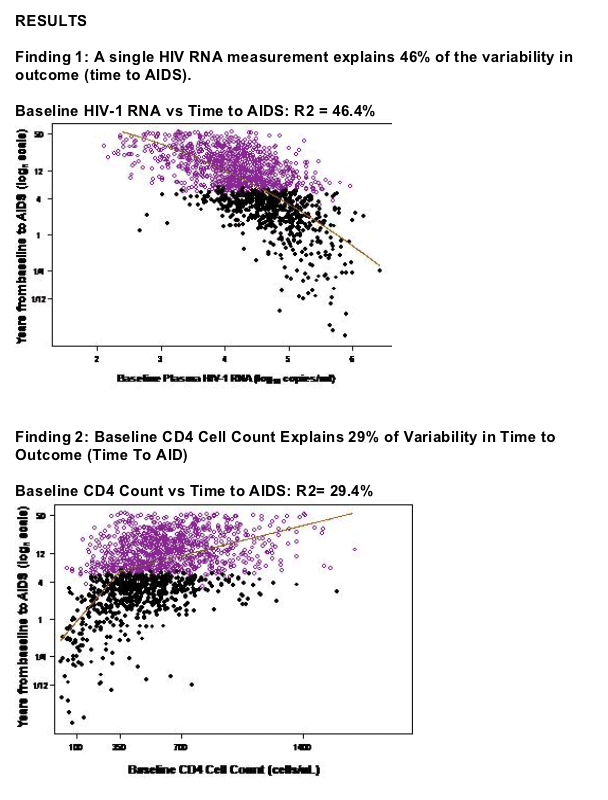
--HIV-1 RNA is the best known predictor of AIDS (and death) over the course of a decade: a single measurement explains about 50% of the variability in outcome
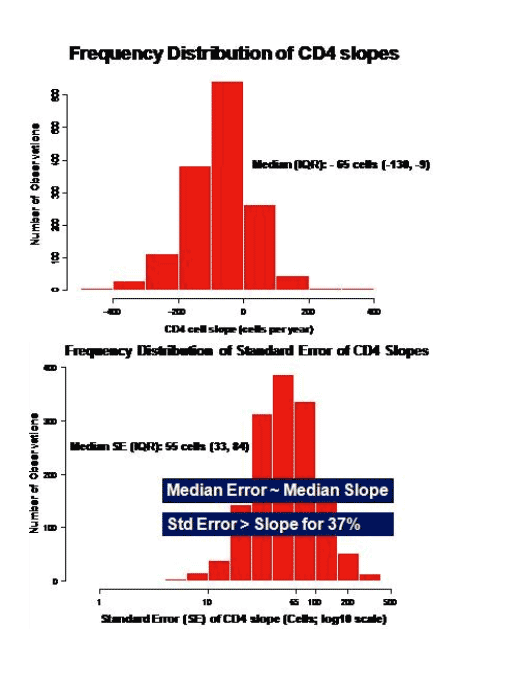
--CD4 slope is a variable measure and is poorly predictive of AIDS: explains only 3% of variability in outcome
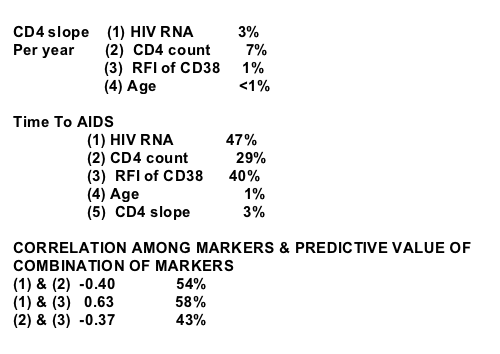
--CD38 RFI is strongly correlated with HIV-1 RNA (r=0.63); increases variability explained from 47% to 58%
IMPLICATIONS
--these results reaffirm the key role of viral replication, as reflected by viremia, in AIDS pathogenesis
--results support the continued use of plasma HIV-1 RNA for estimatingf prognosis in untreated HIV-1 infection
--identifies residual variability in outcome that needs to be explained by other viral, host or envvironmental factors
During the Q&A Dan Kuritzkes made a comment, that CD4 slope may vary over time. In other words, people may have gradual CD4 declines slope, which may accelerate and so CD4 slope closest to an AIDS event may predict better and you need an analysis of time variance. To which Mellors agreed and said using a linear function to describe a CD4 change is gross oversimplification to describe pathogenesis of immunodeficifency. Stratified analysis are being performed now.
In the short term a CD4 count say over the course of the next year may better predict AIDS rather than viral load, Andrew Phillips said at the microphone and Mellors agreed saying he meant HIV RNA predicted AIDS better over a long term such as over a decade.
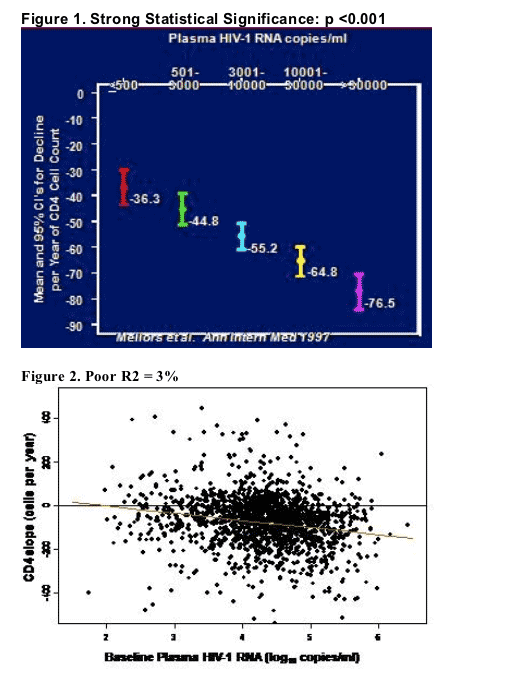
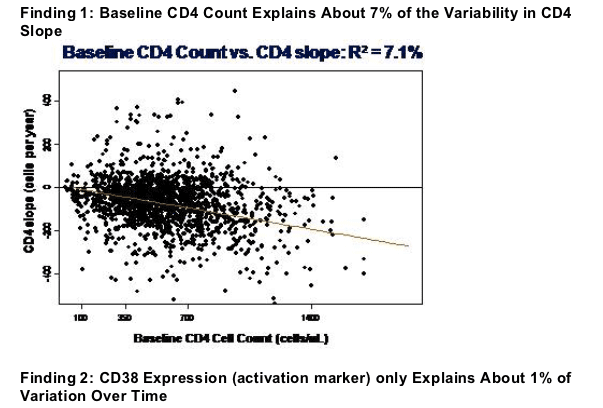
In 1997 Mellors et al published this figure in Annals of Internal Medicine showing a monotonic relationship between baseline plasma HIV RNA and decline of CD4 cells per year. This result was highly statistically significant highly statistically significant association. The point estimates and 95% confidence intervals are shown but note there is significant overlap between the different strata and the confidence intervals. Recently Rodriguez and colleagues in JAMA 2006 analyzed the relationship between HIV RNA and CD4 slope and showed that little of the percent variability in CD4 cell slope was explained by HIV RNA and the calculated R square values or coefficients of determination which times 100 equals percent of variability explained. Mellors said his analysis confirms (Figure 2) Rodriguez's finding that HIV RNA at baseline explains very little of the variability in CD4 slope, 3% in Mellors asnalysis and 4-6% in Rodriguez's analysis.
Mellors repeated Rodriguez's conclusions:
"These findings....challenge the concept that the magnitude of viral replication is the main determinant of the speed of CD4 cell loss at the individual level. Other factors, as yet undefined, likely drive CD4 loss in HIV infection. These findings have implications for treatment decisions and understanding pathogenesis".
So Mellors set out to extend this research. To determine % variability in CD4 cell slope explained by:
--CD4 count
--CD8/CD38 RFO (marker of activation) RFO=relative flourescent intensity
--age
using standard linear regressions for normally distributed outcomes.
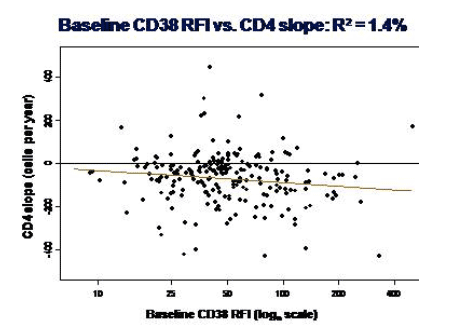
Finding 3: Age explained less than 1% of variability.
Next, Mellors asked:
"How Well does HIV RNA or any other marker we had in our database explain
variability in time to AIDS?
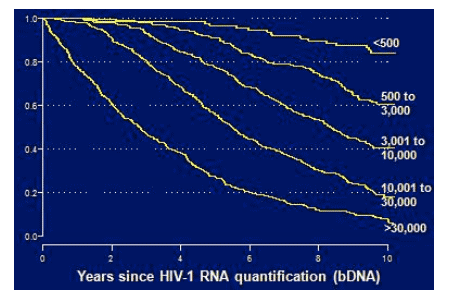
Proportion AIDS-Free by Plasma HIV-1 RNA (copies/ml)
Here is original MACS analysis showing years being AIDS free after a single RNA quantification. And Mellors said you see in his mind extraodinary discrimination in outcome by the RNA strata shown.
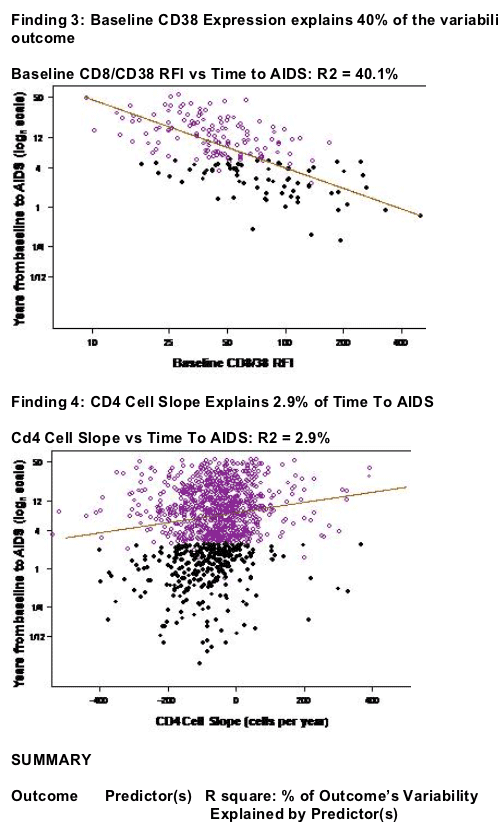
Next Objective: to determine % variability in time to AIDS explained by:
--HIV-1 RNA
--CD4 count
--CD8/CD38 RFI
--CD4 cell slope
Why is CD4 slope difficult to predict?
Why is CD4 slope a poor predictor of AIDS?
Mellors said that although the one-year CD4 decline averaged 65 cells a year in his analysis, it had a huge range from -130 to -9. The inter-quartile range was nine to 130 cells, in other words, about half of the CD4 declines measured were either greater than 130 cells or less than nine cells. And the average error in measuring a CD4 decline can be so large that statistically when taking a single CD4 test the result could be off by 55 cells ranging from 33 to 84.
|
| |
|
|
|
|
|