 |
|
|
| |
Continuation of BID Boosted PI vs Switch to Once-daily Boosted Atazanavir in Subjects with Truncal Adiposity
|
| |
| |
24-week Interim Analysis of the 96-week Multicentre, Open-label, Randomised, Prospective REAL Study (REAL, a REsearch study into Atazanavir and Lipodystrophy)
Reported by Jules Levin
11th EUROPEAN AIDS CONFERENCE/EACS
October 24-27, 2007 Madrid SPAIN
Moyle G1, Andrade J, Girard PM, Antinori A, Salvato P, Bogner JR, Hay P, Santos J, Astier L, Pans M, Jones A, Leleu G, Biguenet S
1HIV Medicine, St. Stephens Centre, Chelsea and Westminster Hospital, London, United Kingdom
AUTHOR'S PRELIMINARY CONCLUSIONS
At week 24: In subjects on boosted PI-based HAART with virological suppression and truncal adiposity, a switch to ATV/r
--Maintained virological control
--Significantly improved key lipid parameters
--Is associated with no significant change at week 24 in fasting glucose parameters, physical parameters, or adipocytokines
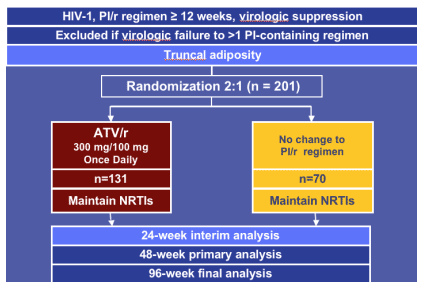
STUDY DESIGN
Patients with belly fat, truncal adiposity which may include trunk fat in addition to belly fat, who were on a boosted PI regimen were randomized 2:1 to switch to boosted atazanavir and maintain the same NRTIs or continue on the same regimen. This presentation is to report the 24 week interim analysis. There will be a reported analysis at weeks 48 and 96.
STUDY OBJECTIVES
Primary objective:
--To compare mean changes in trunk-to-limb fat ratio at Week 48 by DEXA in HIV-infected subjects with truncal adiposity, after switching to ATV/RTV versus remaining on current PI/r
Planned 24-week interim analysis:
Efficacy
--Virologic rebound, CD4 cell count
Safety and tolerability
--Anthropometry
--Fasting glucose metabolism parameters
--Fasting lipid parameters
--Fasting exploratory adipocytokines and hormones
Safety
ENTRY CRITERIA
--HIV-1 infection
--On PI/r + 2 NRTIs for ≥12 weeks immediately prior to screening
--Controlled virologic response (HIV RNA level <400 copies/mL at screening) and stable for ≥6 months
--Excluded if virologic failure to >1 prior PI-containing regimen
Truncal adiposity defined by:
-- WHR >0.90
-- WC >88.2 cm for men and >75.3 cm for women
Demographics and
Baseline Patient Characteristics
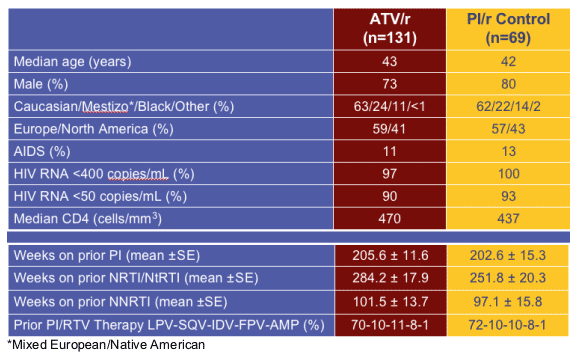
Median age is 43 in ATV/r group and 42 in PI/r control group. 73% of study participants are men in the ATV/r group and 80% are male in the control group. 11-13% had AIDS previously. 97-100% had <400 c/ml. 90-93% had <50 c/ml. median cd4 count was 470 in ATV/r group and 437 in control group.
--Weeks on prior PI: mean 205 in ATV/r group, 202 in control group.
--Weeks on prior NRTI/NtRTI: mean 284 in ATV/R group, 251 in control group.
--Weeks on prior NNRTI: 101 weeks in ATV/r group, 97 in control group.
--Prior PI/r therapy LPV, SQV, IDV, FPV, AMP (%): 70, 10, 11, 8, 1.
Baseline Patient Characteristics
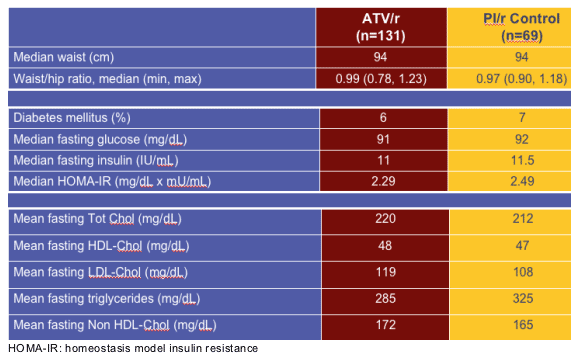
Median waist (cm): 94 in ATV/r group, 94 in control group.
Waist/hip ratio, median (min, max): 0.99 (0.78, 1.23) in ATV/r group, 0.97 (0.90, 1.18) in control group.
Diabetes: 6% in ATV/r group, 7% in control group.
--Median fasting glucose (mg/dL): 91 in ATV/r group, 92 in control group.
--Median fasting insulin (IU/mL): 11 in ATV/r group, 11.5 in control group.
--Median HOMA-IR (mg/dL x mU/mL): 2.29 ATV/r, 2.49 control group.
--Mean fasting total chol (mg/dL): 220 ATV/r, 212 control.
--Mean fasting HDL-C (mg/dl): 48, 47.
--Mean fasting LDL-C (mg/dl): 119 ATV/r, 108 control.
--Mean fasting triglycerides (mg/dl): 285 ATV/r, 325 control.
--Mean fasting non HDL-C (mg/dl): 172 ATV/r, 165 control.
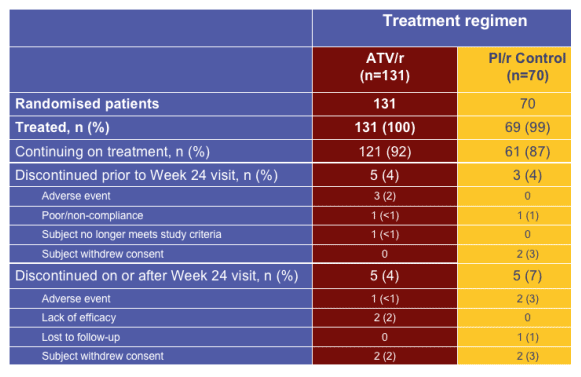
Patient Disposition
There are few discontinuations: 4% in ATV/r group, 4% in control group prior to week 24. On or after week 24, discontinuation rate is 4% in ATV/r group, 7% in control group.
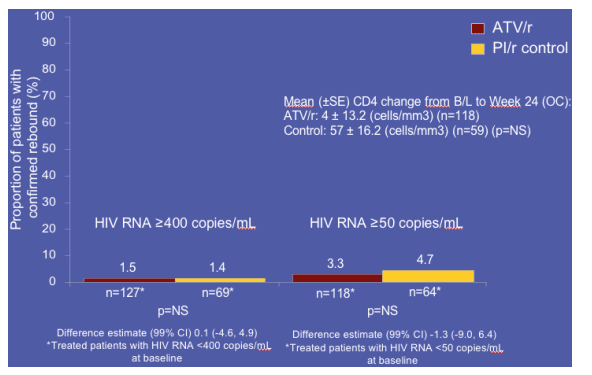
Virological Rebound through Week 24
Viral rebound is very low in both groups with no significant differences between 2 groups: 3.3% rebound >50 in ATV/r group, 4.7% in control group. Rebound >400, 1.5% in ATV/r group, 1.4% in control group.
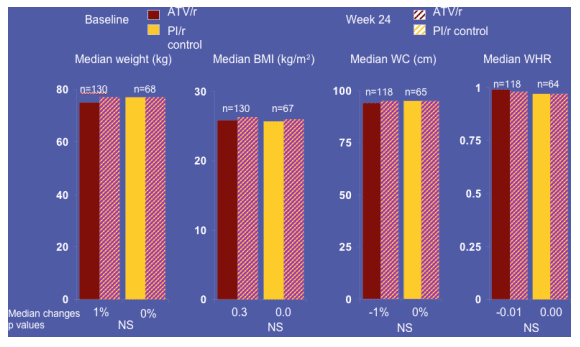
Changes From Baseline in Physical Parameters to Week 24 (LOCF)
There are no changes between baseline and week 24 in median weight, BMI, WC, and WHR for the ATV/r group and for the control group.
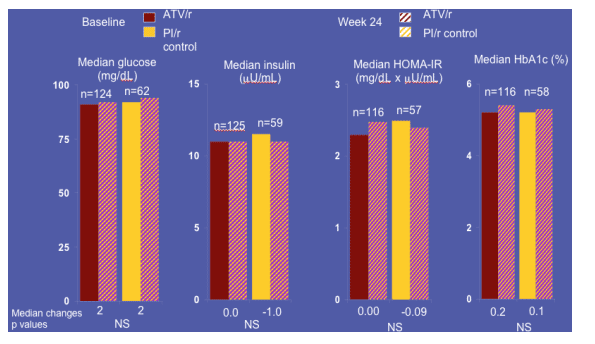
Changes From Baseline in Fasting Glucose Metabolism to Week 24 (LOCF)
There are no significant changes in median glucose, insulin, HOMA-IR, and HbA1c, nor any significant differences in change between the 2 study groups.
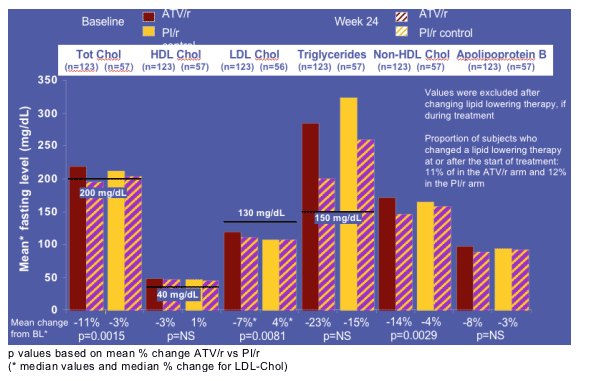
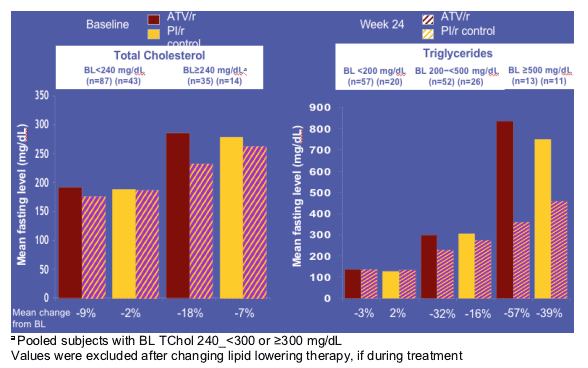
Changes From Baseline in Fasting Lipids
to Week 24 (LOCF)
--Mean change from baseline in total chol: -11% for ATV/r, -3% for controls (p=0.0015).
--Mean change in HDL-C: -3% for ATV/r, 1% for control (p=ns).
--LDL-C: -7% for ATV/r, 4% for control (p=0.0081).
--Triglycerides: -23% for ATV/r, -15% for control (p=ns).
--Non-HDL-C: -14% for ATV/r, -4% for control (p=0.0029).
--Apolipoprotein B: -8% ATV/r, -3% control (p=ns).
Values were excluded after changing lipid lowering therapy, if during treatment. Proportion of subjects who changed a lipid lowering therapy at or after the start of treatment 11% of the ATV/r arm and 12% in the PI/r arm.
Changes From Baseline in selected lipids to Week 24 (LOCF) by Baseline NCEP Category
Triglycerides- for subjects with baselines triglycerides <200 mg/dl there was little change in either group : -3% ATV/r, +2% control group. If triglycerides were 200-500 at baseline subjects taking ATV/r had 32% decline and patients in control group had 16% decline. If baseline triglycerides were >500 mg/dl, patients taking ATV/r had 57% decline and patients in control group had 39% decline.
Total cholesterol- if baseline was <240 mg/dl patients taking ATV/r had 9% decline in total chol and patients in control group had 2% decline. For patients with baseline total chol of >240 mg/dl there was an 18% decline for ATV/r and 7% decline if taking control PI/r.
Changes From Baseline in Adipocytokines to Week 24 (LOCF)
Mean fasting level of adiponectin declined by 0.6 for ATV/r, no change for control (ns)
Resistin: -0.2 ATV/r, -0.1 (ns).
PAI-1: 0.2 ATV/r, -0.3 control (ns).
TNFa: -0.7 ATV/R, 0.0 control (ns).
IL-6: 0.0 ATV/r, 0.0 control.
Hs-CRP: -0.5 ATV/R, -0.1 control (ns).
Fibrinogen: -26, atv/r, 3 control (ns).
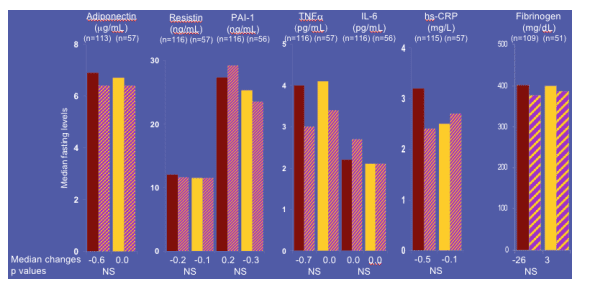
p values based on median change ATV/r vs PI/r
PAI, plasminogen activator inhibitor; TNF, tumour necrosis factor; IL, interleukin; hs-CRP, high-sensitivity C-reactive protein
Selected Adverse Events (AEs)
--3% discontinuations due to AEs in both groups. 2% discontinuatioin rate in ATV/r for hyperbilirubinemia, <1% for jaundice, <1% for Stevens-Johnson syndrome and 0 rate of discontinuation for control group regarding these events.
--Grade 2-4 treatment related AEs (>3%), hyperbilirubinemia: 22% in ATV/r, 0 control. Hypertrygliceridemia: 2% ATV/r, 3% control.
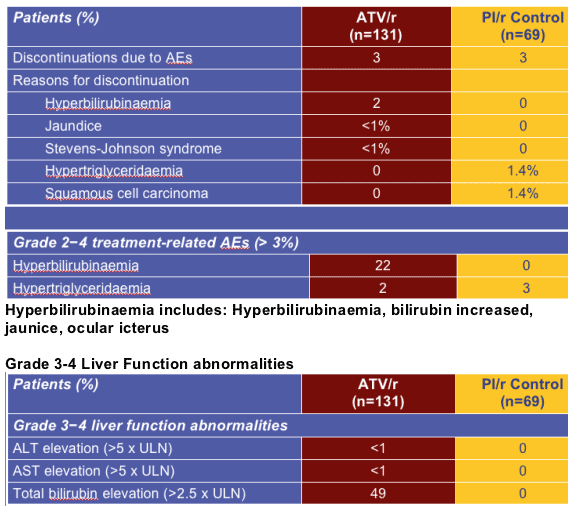
Among patients who experimented a Grade 3-4 hyperbilirubinemia in the ATV/r group, only 1 (<1%) concomitant grade 3-4 transaminases were reported.
|
| |
|
|
|
|
|