 |
|
|
| |
Incidence of Infections in Treatment-experienced Patients Infected with R5 HIV-1 in the MOTIVATE Studies of Maraviroc in Combination with Optimized Background Therapy
|
| |
| |
Reported by Jules Levin
Ninth International Congress on Drug Therapy in HIV Infection
November 9-13, 2008, Glasgow, UK
A Ayoub1, J Goodrich2, R Tressler3, E van der Ryst1, N Rajicic3, S Butelli1, and HB Mayer2
1Pfizer Global Research and Development, Sandwich, UK, and Milan, Italy; 2Pfizer Inc., New London, USA; 3Pfizer Inc., New York, USA
BACKGROUND
In the MOTIVATE 1 and 2, randomized, double-blind, placebo-controlled, Phase 3 studies, patients receiving maraviroc (MVC) QD or BID + optimized background
therapy (OBT) experienced significantly greater virologic suppression (% <400 or
<50 copies/mL), greater CD4+ cell count increases, and a similar adverse event (AE) profile at Week 24 and 48 compared to those receiving placebo (PBO) + OBT.1,2
Based on the results of the MOTIVATE studies, MVC, a CCR5 antagonist, has been approved for BID administration as part of a combination antiretroviral therapy in treatment-experienced patients infected with CCR5-tropic (R5) HIV-1.
However, due to its mechanism of action, blockade of a chemokine receptor, concerns have been raised that the use of MVC may negatively impact the immune system and result in increased risk of, or severity of, infections.
This concern has been underscored by the mouse CCR5 knock-out model and/or
epidemiologic studies that suggest that individuals who lack CCR5 receptors (CCR5 delta 32 homozygotes) may be at increased risk for severe West Nile virus disease or tick-borne encephalitis.3-5
OBJECTIVES
This analysis explores the combined MOTIVATE 1 and 2 data sets to assess if there is evidence of a higher incidence of infections or severity of infections in patients who received MVC (BID or QD) + OBT compared to those who received PBO + OBT.
METHODS
MOTIVATE 1 (North America) and 2 (North and South America, Europe, Australia) were identical double-blind, Phase 3 studies that enrolled triple-class-experienced or
-- resistant patients infected with R5 HIV-1 (Trofile, Monogram Biosciences) with HIV-1 RNA >5,000 copies/mL. Patients received OBT and were randomized 2:2:1 to receive MVC QD, MVC BID, or PBO, respectively.1 Patients remained on blinded therapy through Week 48.
Adverse events were collected at each study visit, coded according to the WHO
medical dictionary, MedDRA 10.1, and graded according to the Division of AIDS,
ACTG table for severity of adverse events in adults.
Because the overall incidence of infections and infestations (all AEs, serious AEs, serious and life-threatening [Grade 3 and 4] AEs, Category C [AIDS-defining] events, and discontinuations), CD4+ cell count increase, and CD4+ shift values were similar in both studies and in both MVC-containing arms in each study, the two MVC-containing arms from MOTIVATE 1 and 2 were combined to increase the power to detect a potential signal.
Descriptive summaries of baseline demographics, HIV disease characteristics,
changes in viral load, and changes in CD4+ cell count are presented.
Descriptive statistics for incidence of infection, exposure-adjusted incidence (per 100 years of patient study-treatment exposure), and risk ratios with 95% confidence intervals are presented.
Times to and risk factors for infections and Category C infections were explored using Cox proportional hazards models. Category C illnesses are generally associated with lower CD4+ cell counts. Therefore, several analyses were undertaken to evaluate the effect of MVC on the ability of patients to achieve clinically relevant CD4+ count thresholds and to assess the impact of CD4+ cell count on Category C events.
HCV RNA values over time are presented to evaluate the potential effect of MVC on ongoing co-infections.
RESULTS
A combined 840 treatment-experienced patients received either MVC QD (N=414) or BID (N=426) + OBT in MOTIVATE 1 and 2, and 209 received PBO + OBT. The groups were similar in terms of baseline demographics and HIV disease characteristics.1
The numbers of patients reporting adverse events of infections or infestations
(grades 1-4) were slightly higher in the MVC + OBT group vs PBO + OBT group
(Figure 1, Table 1), but the exposure for the MVC + OBT group was 609 patient-years (PY) compared to 111 PY in the PBO + OBT group.
Adjustment for duration of exposure showed that the incidence of infections and
infestations was similar between the MVC + OBT and PBO + OBT groups for the most common infections, regardless of grade. The incidences of pneumonia and
Mycobacterium avium complex were statistically significantly lower in the MVC + OBT group (Figure 1). Although not statistically significantly different, the incidences of upper respiratory tract infections, herpes simplex, and otitis media were >/= 2x higher in the MVC + OBT group (Figure 1). Risk ratios could not be calculated for the events of influenza and oral herpes as no event was reported in the PBO + OBT group.
Infections and infestations are presented by ACTG grade in Table 1. Mild-to-moderate infections (grades 1 and 2) were slightly more common in the MVC + OBT group than in the PBO + OBT group. Despite the difference in exposure, the unadjusted incidences of severe and life-threatening infections and infestations (grades 3 and 4) were similar between the two treatment groups. The exposure-adjusted incidences of severe and life-threatening infections and infestations were slightly lower in the MVC + OBT vs the PBO + OBT group (Table 1).
Figure 1. Infections/infestations (grades 1-4), regardless of causality, occurring at >2.0% frequency* a) unadjusted and b) adjusted for study treatment exposure (per 100 PY) by treatment group through Week 48
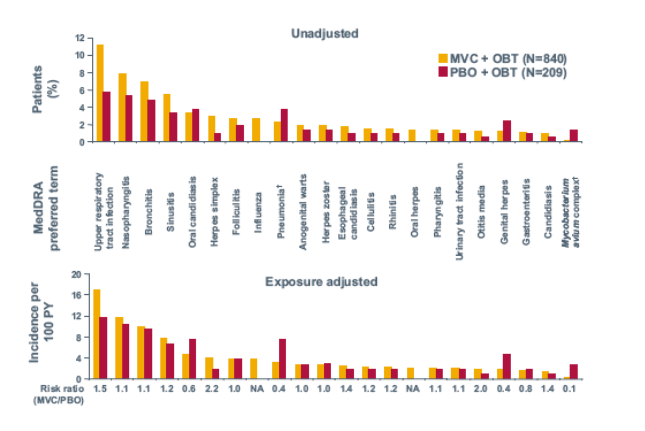
If the same patient in a given treatment group had more than one occurrence in the same preferred term event category, only
the most severe occurrence is taken. Event counts are adjusted to 100 years of patient exposure to study treatment.
Includes data up to 7 days after last dose of study drug.
* In any treatment arm (MVC BID, MVC QD, or PBO); N/A, not applicable - no event reported in PBO group. Exposure-adjusted
incidences were significantly lower in the MVC + OBT group vs PBO + OBT group for pneumonia (risk ratio 0.4; 95%
confidence interval [CI] 0.19, 0.99) and Mycobacterium avium complex (risk ratio 0.1; 95% CI 0.02, 0.66).
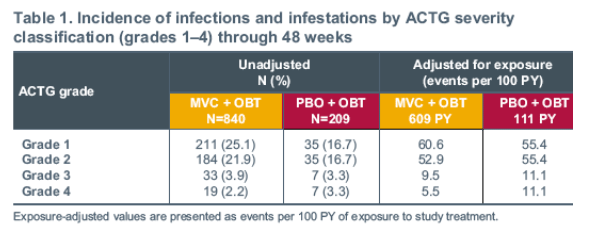
There was no clear difference in the severity of the infections between the MVC + OBT and PBO + OBT groups. Most (88%) infection-related AEs were mild to moderate in severity (Table 1).
No unusual infections occurred in either treatment group and there were no cases of West Nile virus infection or encephalitis reported through 48 weeks.
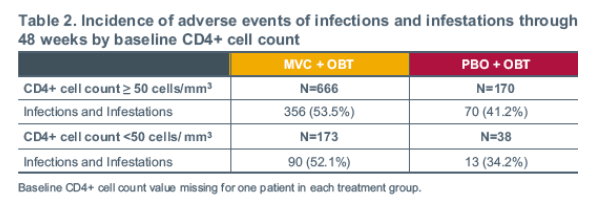
The overall incidence of AEs related to infection or infestation was not affected by the baseline CD4+ cell count (Table 2) in the MVC + OBT group.
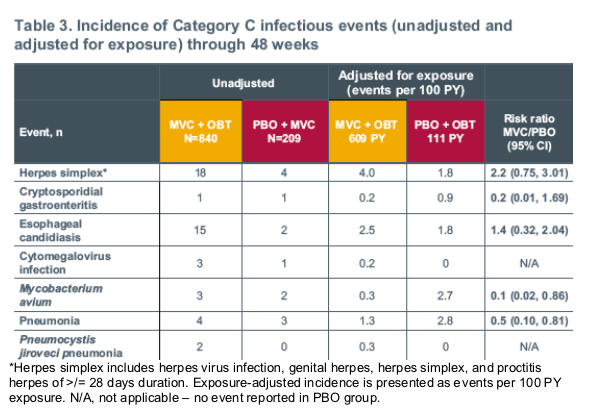
Category C (AIDS-defining) infections
Overall, the observed incidence of exposure-adjusted Category C infections was lower in the MVC + OBT group than in the PBO + OBT group (Table 3). The incidences of pneumonia and Mycobacterium avium complex were statistically significantly lower in the MVC + OBT group compared to the PBO + OBT group.
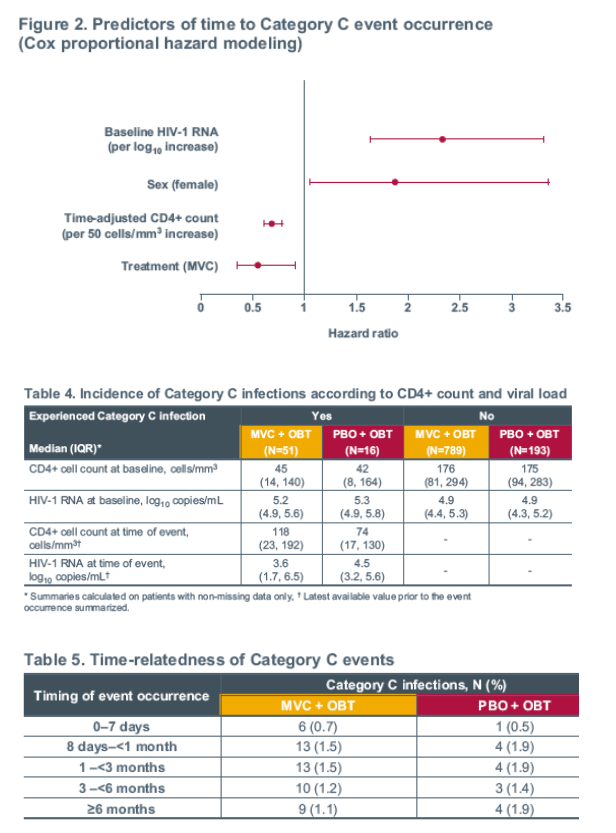
Predictors of Category C events cell counts at 48 weeks with MVC
Baseline HIV-1 RNA (P<0.001), time-adjusted CD4+ cell count (P<0.001), and gender (P=0.042) were all significant predictors of Category C events in a multivariate analysis (Figure 2 and Table 4). Baseline CD4+ cell count and ever achieving <50 HIV-1 RNA copies/mL were not significant predictors.
Due to the association between MVC treatment and greater CD4+ cell counts on therapy, treatment modality (MVC vs PBO) was a significant predictor of time to
Category C events only when time-adjusted CD4+ cell count was not included in the model.
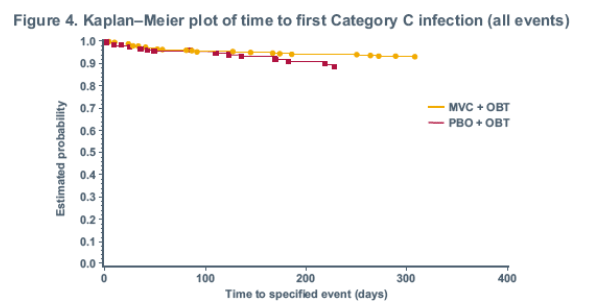
The PBO + OBT group had a shorter median time to the onset of infections and
infestations compared to the MVC + OBT group (0.42 years vs 1.02 years,
respectively; P<0.0001) (Table 5 and Figure 4).
There were no significant differences in the percentage of patients experiencing a Category C event over relatively short time intervals (Table 5), but the differences were statistically significant when evaluated over the first 48 weeks of the study with fewer Category C events in the MVC + OBT vs the PBO + OBT group.
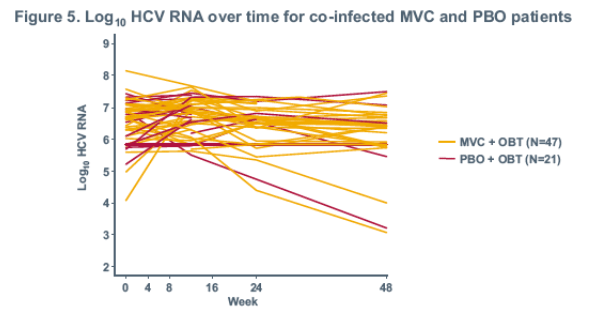
Hepatitis C (HCV) co-infection
Only 6% of the overall patient population were co-infected with HCV at time of study enrolment.2 However, in these patients there was no adverse effect on HCV RNA values over time associated with MVC + OBT use (Figure 5).
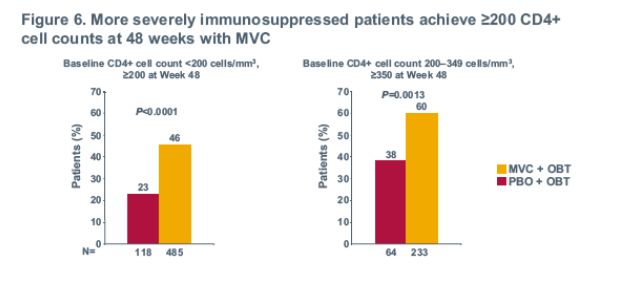
Restoration of CD4+ cell count
Patients receiving MVC + OBT experienced a greater CD4+ cell count increase from baseline to Week 48 (last observation carried forward) vs the PBO + OBT group.1
More patients who received MVC + OBT experienced a CD4+ count increase to the next higher CD4+ count threshold than patients who received PBO + OBT (Figure 6).
AUTHOR CONCLUSIONS
Data from the MOTIVATE 1 and 2 studies through Week 48 (609 patient-years of
MVC exposure) in treatment-experienced patients do not indicate an increased
incidence or greater severity of infections or infestations in patients receiving
MVC + OBT vs those receiving PBO + OBT.
Most infections and infestations were mild to moderate in severity.
No unusual infections, encephalitis, or West Nile virus infections were reported. The percentage of patients experiencing severe or life-threatening (grade 3 or 4) events was slightly less common in the MVC + OBT vs the PBO + OBT group when adjusted for duration of exposure.
There was not a statistically significantly higher incidence of upper respiratory tract infections, herpes simplex infections, and otitis media in the MVC + OBT group. However, the incidences of Mycobacterium avium complex, pneumonia, and total Category C in patients were statistically significantly lower in the MVC + OBT group vs the PBO + OBT group when adjusted for duration of exposure.
Longer duration of MVC therapy, baseline viral load, and CD4+ cell count did not
show any effect on the incidence of infections or infestations in the MVC + OBT
group, and no significant difference in the time to onset of these events was
observed.
There was no difference in hepatitis C RNA values over time in HIV/HCV co-infected patients receiving MVC + OBT vs those receiving PBO + OBT.
Patients receiving MVC + OBT experienced greater CD4+ cell count increases
through 48 weeks vs those receiving PBO + OBT, and more patients in the MVC
group crossed clinically meaningful CD4+ cell count thresholds by Week 48.
References
1. Gulick RM, et al. N Engl J Med 2008; 359:1429-1441.
2. Fätkenheuer G, et al. N Engl J Med 2008; 359:1442-1455.
3. Glass WG, et al. J Exp Med 2006; 203:35-40.
4. Lim JK, et al. J Infect Dis 2008; 197:262-265.
5. Kindberg E, et al. J Infect Dic 2008; 197:266-269.
|
| |
|
|
|
|
|