 |
|
|
| |
Early Virological and Immunological Response is Comparable between Nevirapine and RTV-boosted Atazanavir: An ARTEN Sub-analysis
|
| |
| |
Reported by Jules Levin
ICAAC Set 12 2009 San Francisco
Johnson M1, Soriano V2, Brockmeyer N3,Winston A4, Gellermann H J5, Cairns V5 and De Rossi L5
1Royal Free Hospital, London, Great Britain; 2Hospital Carlos III, Madrid, Spain; 3Ruhr-Universitat Bochum, Bochum, Germany; 4St Mary's Hospital, London, Great Britain; 5Boehringer Ingelheim, Ingelheim, Germany
IAS/Capetown: Prospective randomised comparison of Nevirapine and Atazanavir/ritonavir both combined with Tenofovir DF/Emtricitabine in treatment-naive HIV-1 infected patients: ARTEN Study week 48 results - (07/20/09)
Author Conclusions
In general, early virological and immunological responses were comparable between NVP and ATZ/r
However, VL decay within the first 4 weeks and time to treatment response were
significantly better for NVP compared with ATZ/r
Non-inferiority between NVP and ATZ/r (both combined with fixed dose TDF/FTC) with regard to TR at Week 48 was established
The ARTEN study confirms that the combination of NVP and TDF/FTC is effective in treatment-naïve patients, including those with high VL at baseline
The ARTEN study demonstrates that NVP is an effective and well tolerated ARV for first-line therapy, when used in accordance with the guideline-recommended CD4+ cell count thresholds for NVP of <250 cells/mm3 in women and <400 cells/mm3 in men
Abstract
Background: Early virological response has been proposed as a marker of early efficacy of HAART. In ARTEN, nevirapine (NVP) showed a similar efficacy to ritonavir boosted atazanavir (ATZ/r),with amore favourable lipid profile after 48 weeks.1 This subanalysis presents the early virological and immunological response data.
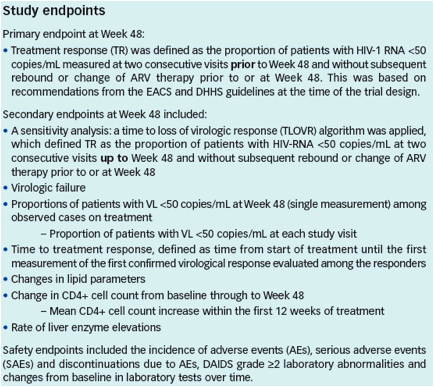
Methods: Analysis was of early viral decay (log10), percentage of patients with HIV-RNA <50 copies/mL at each visit and mean CD4+ cell count increase within the first 12 weeks of treatment in the ARTEN study. Time to treatment response (TTR) was defined as time from start of treatment until the first measurement of the first confirmed virological response evaluated among the responders.
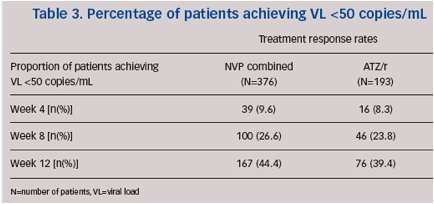
Results: 62.8% of 376 patients in the combined NVP armand 65.8% of 193 patients in the ATZ/r arm had VL >100,000 copies/mL at baseline. Comparing all NVP vs.ATZ/r patients at weeks 4, 8 and 12, 9.6% vs. 8.3%, 26.6% vs. 23.8%, and 44.4% vs 39.4% achieved VL<50 copies/mL, respectively
Distributions of TTR were significantly better for combined NVP than for ATZ/r (Cox hazard ratio 0.74; Cox regression p=0.003).
Conclusions: NVP and ATZ/r, both combined with TDF/FTC, led to comparable virological and immunological responses. However, VL decay within the first 4 weeks and TTR were significantly better for NVP.
Reference: 1. Soriano V et al. 5th IAS Conference on HIV Pathogenesis, Treatment and Prevention, Cape Town, 19-22 Jul 2009 (Poster LBPEB07).
Introduction
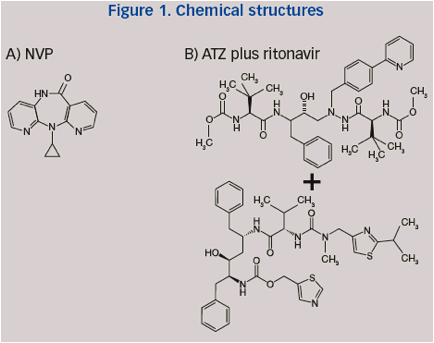
The ARTEN Phase IIIb trial compared the virologic efficacy and safety of nevirapine (NVP) (Figure 1) and ritonavir-boosted atazanavir (ATZ/r) (Figure 1) both in combination with tenofovir DF and emtricitabine (TDF/FTC).1
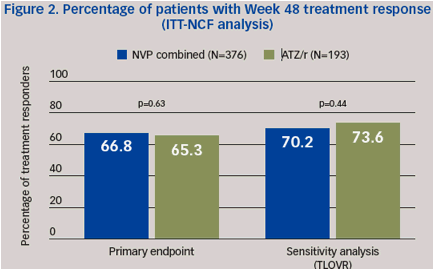
In the ARTEN study, NVP showed a similar efficacy to ATZ/r (Figure 2) with a more favourable lipid profile after 48 weeks.1
On-treatment, early predictors (e.g. assessment of viral load [VL] change 4 to 12 weeks after initiating therapy) have been investigated in the past to evaluate whether they serve as an indicator of longer-term virologic responses.2-4
Early predictors for long-term treatment response can be used to prevent the
accumulation of drug-resistance-associated mutations and the development of drug-related adverse events, by avoiding unnecessary exposure to ineffective regimens.5
This subanalysis presents the early virological and immunological response data from the ARTEN study.
Methods
ARTEN was an open-label, randomised, international, non-inferiority clinical trial comparing the efficacy and safety of NVP versus ATZ/r in a total of 569 ARV-naïve patients with HIV-1-infection. It was the first prospective clinical trial to apply the guideline-recommended CD4+ cell count thresholds, of <250 cells/mm3 in women and <400 cells/mm3 in men, to the administration of NVP.6-9The ARTEN study included one armwith patients treated with NVP once-daily dosing. NVP is not indicated for once-daily dosing. The efficacy and safety
of NVP once-daily dosing have not been established.
Results of subanalyses of the ARTEN study are reported here on early viral decay (log10), the percentage of patients with HIV-RNA <50 copies/mL at each visit, and CD4+ cell count increase within the first 12 weeks of treatment.
Inclusion/exclusion criteria
Key inclusion criteria:
· HIV-1-infected patients aged ≥18 years
· Adequate renal function (creatinine clearance ≥50 mL/min)
· Not previously treated with ARVs for >7 days
· CD4+ cell counts <400 cells/mm3 or <250 cells/mm3 for male and female patients respectively
Key exclusion criteria:
· Hepatic cirrhosis stage Child-Pugh B or C
· DAIDS grade >2 laboratory parameters (DAIDS grade >3 triglycerides)
· Active hepatitis B or C, defined as HBsAg-positive or HCV-RNA positive with AST/ALT >2.5x ULN (DAIDS grade 1)
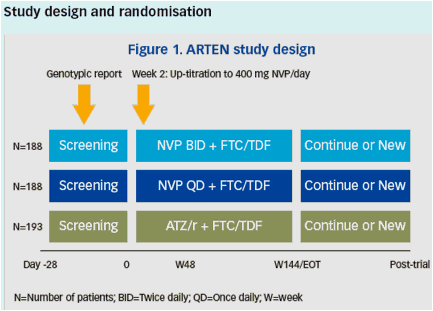
Patients were randomised (1:1:1) to receive i) NVP 200 mg BID, ii) NVP 400 mg QD or iii) ATZ 300mg QD plus RTV 100mg QD (ATZ/r), in combination with fixed-dose FTC 200mg QD/TDF 300mg QD. Randomisation was stratified according to HIV-1 RNA (>100,000 copies/mL or ≤100,000 copies/mL) and CD4+ cell count (≥50 cells/mm3 or <50 cells/mm3) at screening. During the first 14 days of the study both NVP BID and NVP QD dose groups started out with a lead-in dose of NVP 200mg QD according to the product label.
Results
Demographic data and HIV baseline characteristics
A total of 576 patients were enrolled and randomised to treatment; 569 received study
medication (70.8% inWestern Europe, 21.4% in Latin America and 7.7% in Eastern Europe).
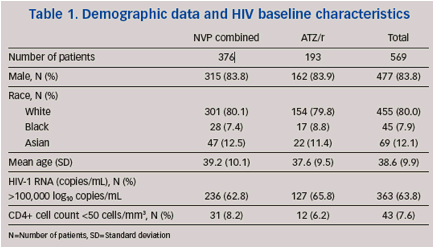
ByWeek 48, 41/188 (21.8%) patients treated with NVP QD, 53/188 (28.2%) patients treated
with NVP BID and 18/193 (9.3%) patients treated with ATZ/r discontinued their study
medication.
Primary efficacy and safety results
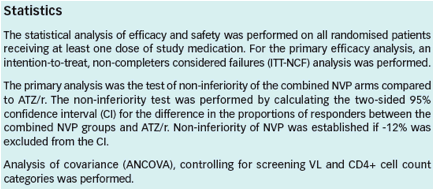
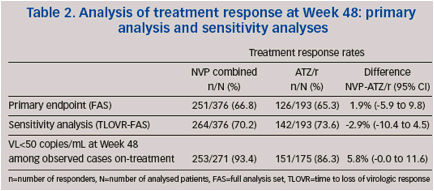
Primary efficacy and safety data have been presented previously1 and are summarized below. At Week 48, a comparable proportion of patients achieved and maintained a TR (primary endpoint, ITT-NCF analysis) in the NVP group compared with the ATZ/r group (Table 2).
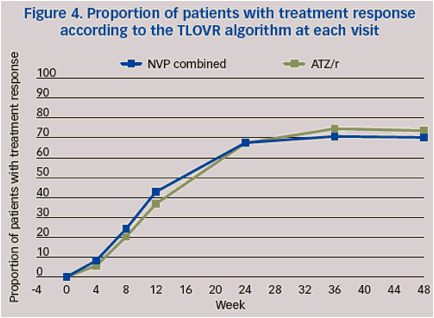
Non-inferiority of NVP vs. ATZ/r was established in the primary analysis (lower limit of the CI was above the pre-defined -12% non-inferioritymargin atWeek 48), and was confirmed by the sensitivity analysis (TLOVR algorithm) (Table 2).
Overall, AE rates were similar between groups (85.9% among NVP patients and 86.5% among ATZ/r patients). However, despite similar AE rates, the incidence of AE-related treatment discontinuations was lower with ATZ/r than with NVP (3.6% vs. 13.6%). Rash was reported in 16.0% of NVP and 12.4% of ATZ/r patients, but more NVP patients were discontinued due to rash compared with ATZ/r (5.1% vs. 0%).
Most NVP-associated rashes developed during the lead-in phase. No Grade 4 rashes were observed. No cases of Stevens-Johnson syndrome, toxic epidermal necrolysis, or deaths due to liver or skin toxicity occurred.
Early virological and immunological response data
Percentage of patients with HIV-RNA <50 copies/mL
At baseline, >60% of patients in both the combined NVP arm and ATZ/r arm had a VL >100,000 copies/mL.At weeks 8 and 12, a comparable proportion of all patients achieved VL<50 copies/mL in the combined NVP group compared with the ATZ/r group (Table 3, Figure 4).
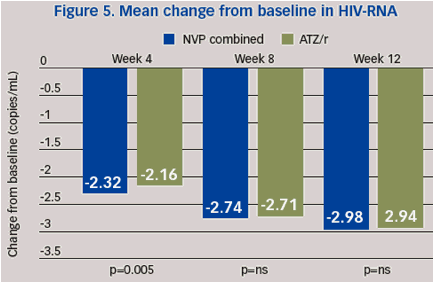
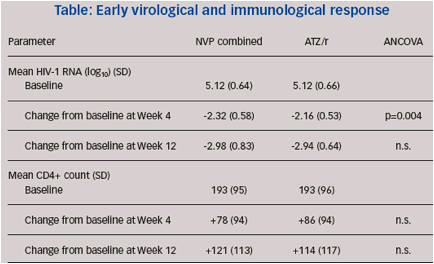
Mean HIV-RNA (log10) at baseline was 5.12 copies/mL in the combined NVP arm and 5.12 copies/mL in the ATZ/r arm. Among NVP patients, mean change from baseline to Week 4 in HIV-RNA (log10) was -2.32 copies/mL compared with -2.16 copies/mL for ATZ/r patients (p=0.045, ANCOVA difference 95% CI). Changes in HIV-RNA from baseline to Week 12 were not significantly different (Figure 5).
CD4+ cell counts
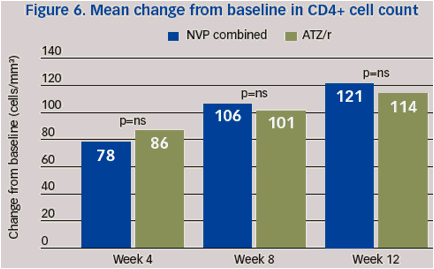
The baseline CD4+ cell count was 193 cells/mm3 for both the combined NVP and ATZ/r treatment groups. The mean changes in CD4+ cell counts from baseline to Weeks 4 and 12 were not statistically different between the combined NVP and ATZ/r groups (Figure 6).
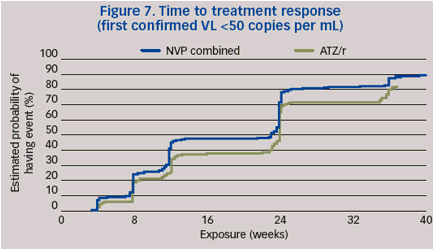
Time to treatment response
The Kaplan-Meier distributions of time to treatment response were significantly better for combined NVP than for ATZ/r. (Cox hazard ratio 0.74; Cox regression p=0.003 [95% CI 0.60 to 0.90]) (Figure 7).
References
1. Soriano V et al. 5th IAS Conference on HIV Pathogenesis,Treatment and Prevention, Cape Town, 19-22 Jul 2009 (Poster LBPEB07).
2. Huang W et al. J Infect Dis 2001; 183(10): 1455- 1465.
3. PowderlyWG et al.AIDS 1999; 13(14): 1873-1880.
4. Raffi F et al.Clin Infect Dis 2006; 42(6): 870-877.
5. PolisMA et al. Lancet 2001; 358(9295): 1760-1765.
6. Gazzard BG.HIVMed 2008; 9(8): 563-608.
7. DHHS. Panel on Guidelines for Adults and Adolescents (November 2008).
Available at http://www.aidsinfo.nih.gov/ContentFiles/AdultandAdolescentGL.pdf.
Last accessed 15 November 2008.
8. EACS Guidelines for the clinical management and treatment of HIV infected adults in Europe.Available at http://www.eacs.eu/guide/index.htm.
Last accessed 08 February 2009.
9. Hammer SM et al. JAMA 2008; 300(5): 555-570.
|
| |
|
|
|
|
|