 |
|
|
| |
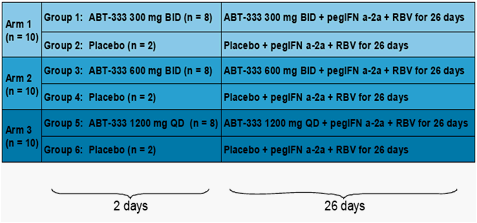
Pharmacokinetics of a Polymerase Inhibitor, ABT-333, in Treatment-naïve HCV Genotype 1-Infected Subjects Following Treatment with 2 days of ABT-333 Followed by 26 Days of ABT-333 Plus Pegylated Interferon and Ribavirin
|
| |
| |
Reported by Jules Levin
HepDART 2009 - 06-10 December 2009 - Kohala Coast, Hawaii, USA
Cheri E Klein, Rajeev M Menon, Daniel E Cohen, Walid M Awni, Barry M Bernstein (Abbott, Abbott Park, IL USA)
Corresponding author: Rajeev Menon, Abbott, 100 Abbott Park Road, Dept. R4PK, AP13A, Abbott Park, IL 60064, USA
AUTHOR CONCLUSIONS
Overall, mean Cmax and AUC values increased with increasing doses and were comparable to those from healthy subjects.
Mean trough values indicated that addition of pegIFNα-2a and ribavarin does not have a significant impact on ABT-333 pharmacokinetics
ABT-333 did not alter the exposure to either IFNα-2a or ribavirin.
Some subjects had no, or very low, measurable levels of IFNα-2a despite receiving weekly dosing of pegIFNα-2a. The smaller viral load decline in these subjects may be attributed to the low exposure of interferon.
INTRODUCTION
ABT-333 is a novel non-nucleoside sulfonamide palm site NS5B polymerase inhibitor being developed for the treatment of HCV genotype 1 infection.
ABT-333 exhibits highly potent and selective activity against genotype 1a and 1b HCV polymerases.
ABT-333 was safe and well tolerated in single and multiple ascending doses up to the highest doses studied in healthy volunteers: 2000 mg in single doses and 1600 mg BID in multiple doses. Data from a multipledose study for doses from 200 mg BID to 1000 mg BID, using the same formulation as used in the current study, are shown in Table 1.
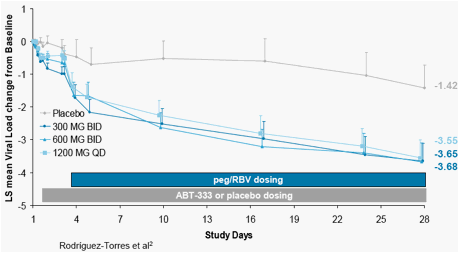
In HCV-infected patients, administration of ABT-333 as monotherapy for 2 days followed by 26 days of ABT-333 in combination with pegIFNα-2a and ribavirin resulted in a greater than 3.5 log drop in viral load from baseline (Figure 1). Pharmacokinetic results of ABT-333, IFNα-2a and ribavirin from this study are discussed here.
Table 1. Mean ± SD ABT-333 Pharmacokinetic Parameters on
Day 1 and Day 10 After Administration of ABT-333 in Healthy Subjects
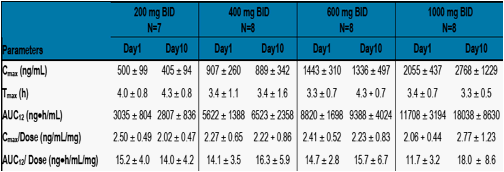
Menon. et al1
Figure 1. Mean HCV RNA Change from Baseline in Patients Treated with ABT-333 as Monotherapy for 2 Days Followed by 26 Days of ABT-333 in Combination with pegIFNα-2a and Ribavirin
OBJECTIVES
The objective of the study was to describe the pharmacokinetics of ABT-333 in HCV-infected subjects over 2 days as monotherapy followed by 26 days of combination with pegIFNα-2a (pegIFN) and ribavirin (RBV) in treatment-naïve, HCV genotype 1-infected subjects.
A second objective was to evaluate the effect of pegIFNα-2a and ribavirin on ABT-333 trough levels and vice-versa.
METHODS
Study Design
All subjects were eligible to receive pegIFNα-2a + ribavirin therapy after
Day 28 for up to 48 weeks total duration.
Pharmacokinetic Assessments
A complete pharmacokinetic profile for ABT-333 was drawn on Day 1 following the dose.
ABT-333 trough samples were collected immediately prior to the morning dose on Days 2, 3, 4, 5 and a single sample was collected on Days10, 17, 24 and 28.
A single sample was collected on Days 3, 4, 5,10,17, 24 and 28 for IFNα-2a and ribavirin levels.
ABT-333 concentrations were determined by a validated high performance liquid chromatography tandem mass spectroscopy method (HPLC/MS/MS).
IFNα-2a concentrations were determined by HPLC/MS/MS and ribavirin concentrations were determined by enzyme-linked immunosorbent assay (ELISA).
Pharmacokinetic parameters of ABT-333 on Day 1 were estimated by noncompartmental methods using SAS version 9.1 (Cary, NC).
Statistical Methods
Statistical analysis was conducted using SAS version 9.1 (Cary, NC).
Dose proportionality analysis was conducted on dose-normalized and
log-transformed Cmax and AUC12 values.
The effect of pegIFNα-2a and ribavirin on the pharmacokinetics of ABT-333 was evaluated using the natural logarithms of Ctrough. The change in Ctrough occurring between administration of ABT-333 alone (Ctrough on Day 3, prior to the first dose of combination therapy) and concomitant administration of ABT 333 plus pegIFNα-2a and ribavirin (Ctrough on Day 4) was analyzed by a paired t-test.
Effect of ABT-333 on IFNα-2a and ribavirin concentrations were conducted using an analysis of variance (ANOVA).
RESULTS
Table 2. Mean ± SD ABT-333 Pharmacokinetic Parameters on
Day 1 and Day 10 After Administration of ABT-333 in Healthy Subjects
Pharmacokinetic Results
The mean +SD concentration-time profiles of ABT-333 following the first
dose are given in Figure 2.
Cmax and AUC12 values for ABT-333 increased with increasing dose as
shown in Table 3.
Mean dose normalized Cmax and AUC12 values appeared to decrease with dose but the values were not significantly different (p>0.05).
\Mean Tmax values were 3-4 hours across all dose groups.
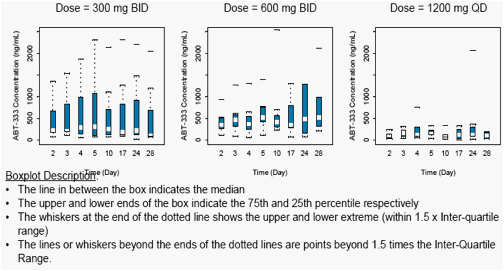
Figure 3 displays the average concentrations on Day 2 through Day 28 for ABT-333 300 mg BID to 1200 mg QD. The mean values were similar across Days 2 to 28, indicating that ABT-333 reached steady state by Day 2.
Figure 2. Mean + SD Plasma Concentration-Time Profiles for ABT-333 on Day 1
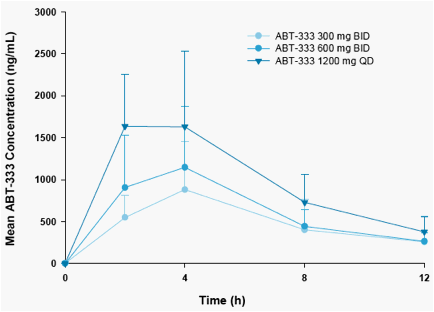
Table 3. Mean + SD ABT-333 Pharmacokinetic Parameters on Day 1 After Administration of ABT-333
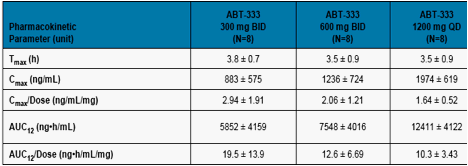
Figure 3. ABT-333 Trough Concentrations from Day 2 to Day 28 across Doses
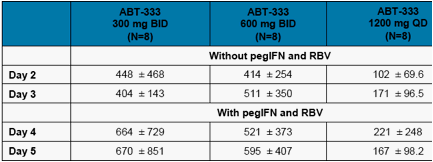
Effect of pegIFNα-2a and Ribavirin on ABT-333
Trough Concentrations of ABT-333 on Day 4 (with pegIFNα-2a and ribavirin) were similar to the trough concentrations on Day 3 (without pegIFNα-2a and ribavirin) as shown in Figure 3 and Table 4 (p>0.05) indicating that addition of pegIFNα-2a and ribavirin did not affect the exposure of ABT-333.
Table 4. Mean + SD ABT-333 Trough Concentrations After Administration of Multiple Doses of ABT-333
Effect of ABT-333 on IFNα-2a and Ribavirin Concentrations
Figures 4 and 5 display the average concentrations of IFNα-2a following a 180 µg dose and average concentrations of ribavirin following 800 to 1200 mg doses from Day 4 through Day 28 receiving concomitant active ABT-333 or ABT-333 placebo.
Concentrations of IFNα-2a and ribavirin when dosed with ABT-333 were comparable to concentrations of IFNα-2a and ribavirin dosed with ABT-333 placebo (p>0.05).
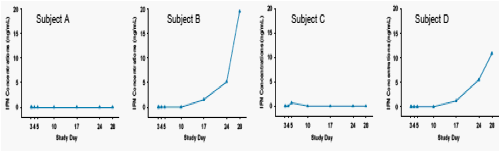
Two subjects had very low or no detectable concentrations of IFNα-2a throughout the study and had very poor response (decrease in viral load) to treatment.
Two other subjects had low or no detectable concentrations following the first 2 doses of pegIFNα-2a . Following the 3rd and 4th pegIFNα-2a doses, these subjects appeared to have much higher IFN concentrations. The decrease in viral load appeared to correlate to IFN concentrations in these subjects
Figure 6 shows the profiles of the 4 subjects described above.
Figure 4. IFN Concentration-Time Profiles with Active or Placebo ABT-333 Following a 180 µg Dose of pegIFNα-2a on Days 3,10, 17 and 24
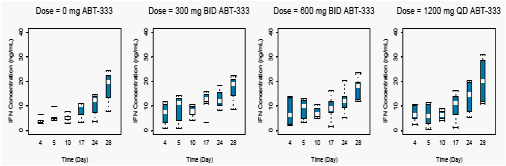
Figure 5. Ribavirin Concentrations with Active or Placebo ABT-333 Following BID Dosing of 800 to 1200 mg Ribavirin on Days 3 through 28
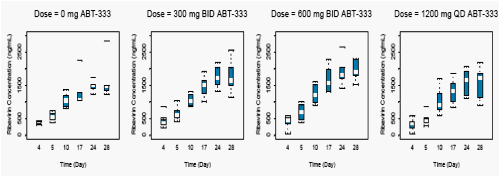
Figure 6. Individual IFN Concentrations for Subjects with Low or No Detectable Levels of IFN
REFERENCES
1. Menon, R. et al, 44th Annual Meeting of EASL, Copenhagen, Denmark, April 22 - 26, 2009. Poster 2067.
2. Maribel Rodriguez-Torres et al, Treatment-naïve, genotype-1 HCV-infected subjects show significantly greater HCV RNA decreases when treated with 28 days of ABT-333 plus peginterferon and ribavirin compared to peginterferon and ribavirin alone, 60th Annual Meeting of AASLD, Boston, USA, October 30-Nov 3.
|
| |
|
|
|
|
|