 |
|
|
| |
Older Age, More Comorbidities
Mean Lower Chance of ART With Medicare
|
| |
| |
International Workshop on HIV & Aging 2023, October 26-27, Washington, DC
Reported by Mark Mascolini for NATAP and Academic Medical Education
Antiretroviral therapy (ART) prescribing became more frequent year by year for most people using Medicare in a 2007-2019 study [1]. But being older and having more comorbidities-or certain comorbidities-lowered chances that a Medicare beneficiary would have an ART prescription.
In 2012 US antiretroviral prescribing guidelines began recommending starting ART upon HIV diagnosis regardless of CD4 count. Researchers working at the University of Texas Medical Branch, Galveston, and colleagues at other centers decided to see whether this guideline has been applied over the years in people using Medicare for health insurance. Medicare covers people 65 or older, certain younger people with disabilities, and people with end-stage renal disease.
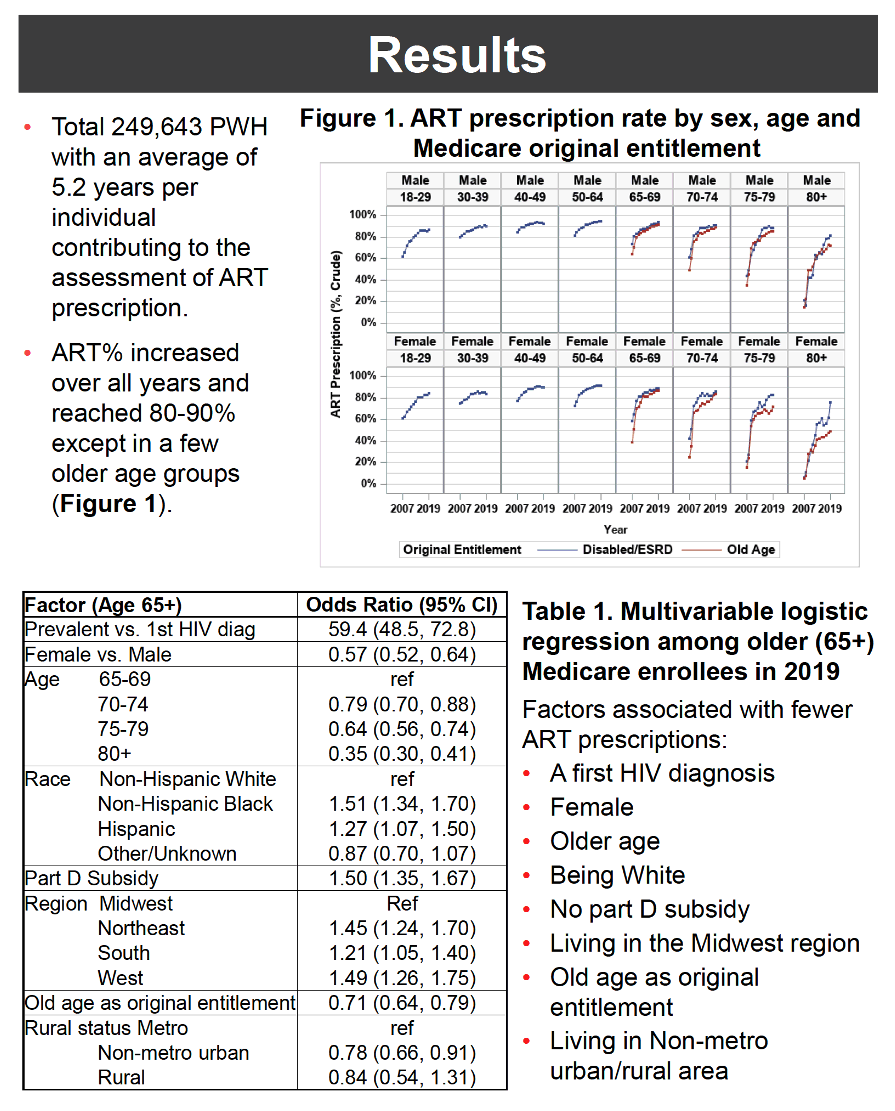
The analysis included all Medicare beneficiaries with an HIV diagnosis from 2007 through 2019 in all 50 states and Washington, DC. Researchers allotted individuals to cross-sectional cohorts for each calendar year. Everyone was at least 18 years old and qualified in that year for fee-for-service and Medicare part D coverage (for prescription drug costs). The investigators calculated the percentage of people with at least 1 antiretroviral prescription for each year according to sex, current age, and original Medicare entitlement.
The study population numbered 249,643, with each person averaging 5.2 years of data contributed to the ART assessment. The percentage of people prescribed ART rose consistently over study years, except in certain older groups, women, and others, as detailed in a multivariate logistic regression analysis in people 65 or older in 2019. Factors linked to lower or higher odds of having an ART prescription included female sex, older age, and white race, as indicated by the following odds ratios (OR) (and 95% confidence intervals):
Lower odds of ART prescription:
- Female vs male: OR 0.57 (0.52 to 0.64)
- Age 70-74 vs 65-69: OR 0.79 (0.70 to 0.88)
- Age 75-79 vs 65-69: OR 0.64 (0.56 to 0.74)
- Age 80 or older vs 65-69: OR 0.35 (0.30 to 0.41)
- Old age as original entitlement: OR 0.71 (0.64 to 0.79)
- Nonmetro urban vs rural status metro:* OR 0.78 (0.66 to 0.91)
Higher odds of ART prescription:
- Prevalent HIV infection vs first HIV diagnosis: OR 59.4 (48.5 to 72.8)
- Non-Hispanic black vs non-Hispanic white: OR 1.51 (1.34 to 1.70)
- Hispanic vs non-Hispanic white: OR 1.27 (1.07 to 1.50)
- Having Medicare part D (drug coverage): OR 1.50 (1.35 to 1.67)
- Living in Northeast vs Midwest: OR 1.45 (1.24 to 1.70)
- Living in South vs Midwest: OR 1.21 (1.05 to 1.40)
- Living in West vs Midwest: OR 1.49 (1.26 to 1.75)
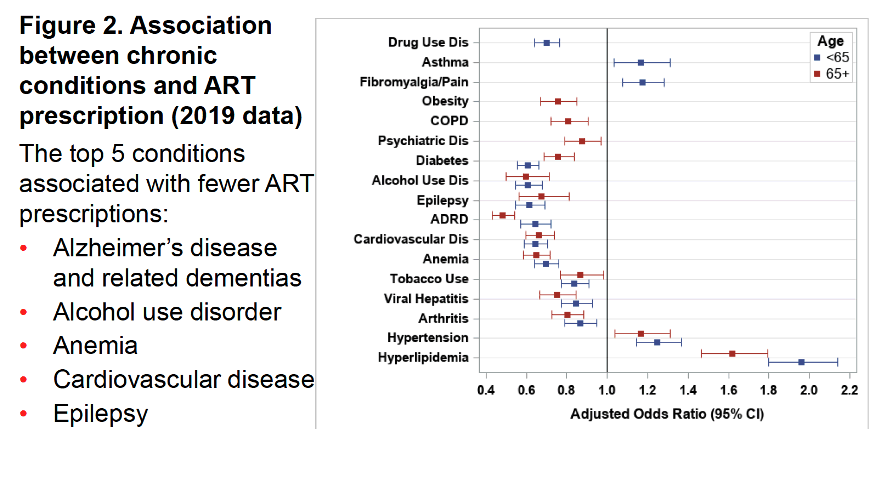
More than a dozen chronic conditions cut chances of having an ART prescription in 2019. The top 5 were:
- Alzheimer's disease and related dementias
- Alcohol use disorder
- Anemia
- Cardiovascular disease
- Epilepsy
Other conditions that lowered chances of getting ART were drug use disorder, obesity, chronic obstructive pulmonary disease, psychiatric disease, diabetes, tobacco use, viral hepatitis, and arthritis. Four conditions raised chances of securing an ART prescription: asthma, fibromyalgia/pain, hypertension, and hyperlipidemia.
White Medicare beneficiaries' lower odds of getting ART than blacks or Hispanics turn the tables on racial disparities seen for many types of care. Some associations between certain chronic conditions and odds of having ART prescribed are well known; others are a surprise. The investigators do not speculate on reasons for any of these demographic or clinical associations.
Reference
1. Yu X, Kuo YF, Giordano TP. Antiretroviral therapy among US Medicare enrollees with HIV. International Workshop on HIV & Aging 2023, October 26-27, Washington, DC. Abstract 13.
*For explanations of these terms, see Economic Research Service, Department of Agriculture. Rural classifications:
https://www.ers.usda.gov/topics/rural-economy-population/rural-classifications/
|
| |
|
|
|
|
|