 |
|
|
| |
Development and Validation of the Collagen Neo-Epitope Biomarker Pro-C3 "FIB-C3 Score" for Detection and Staging of Advanced Non-Alcoholic Fatty Liver Disease in a Large International Multi-Centre Patient Cohort
|
| |
| |
Reported by Jules Levin
AASLD Annual Meeting 2017, Washington, DC, USA, October 20-24
Marie Boyle1 Dina Tiniakos1, Stuart McPherson1, Vlad Ratziu2, Pierre Bedossa3, Tim Hardy1, Jorn M. Schattenberg4, Claudia P. Olivieira5, Elisabetta Bugianessi6, Salvatore Petta7, Mette J Nielsen8, Morten Karsdal8, Diana Leeming8, Stuart Kendrick9 & Quentin M. Anstee1 for the EPoS Investigators


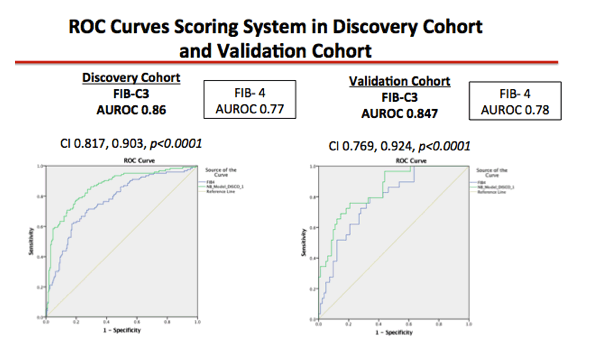
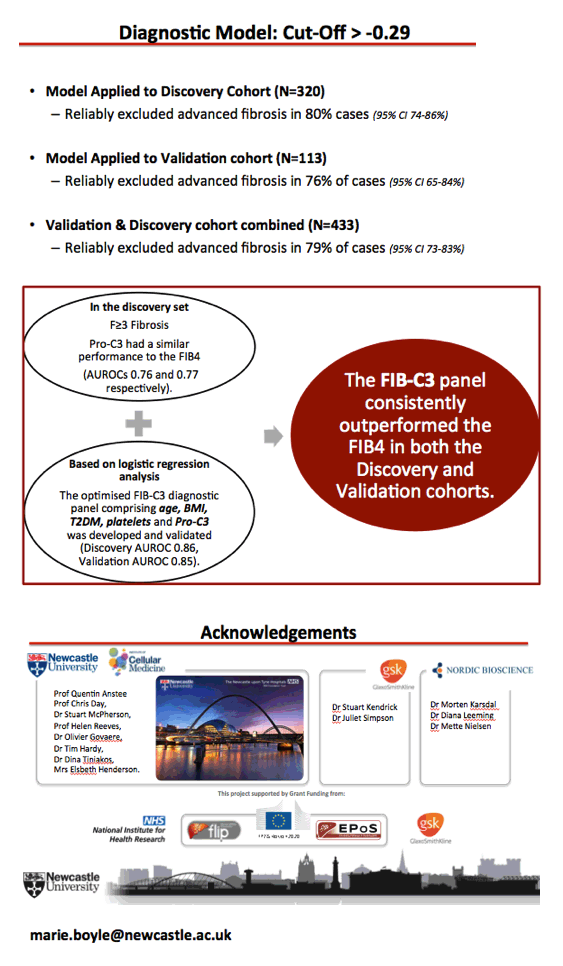
Moving onto 'Model Building'. Using these 5 variables, we constructed a model to distinguish between patients with F3/F4 and without (F0-F2) advanced fibrosis. This scoring system had an AUROC of 0.86. CI. Using the AUROC, we identifed a cut-off point to identify the presence (>-0.29) of significant fibrosis. The diagnostic accuracy of the scoring system in separating patients with and without advanced fibrosis was cross-validated in a separate set of 113 patients. The AUROC remained high in the validation set with an AUROC of 0.847, indicative of a 'good' diagnostic test being in the range of 0.8-0.9. FIB C4 diagnostic model preformed better than the validated FIB4 test in both the validation and discovery cohort.

The prevalence of advanced fibrosis in the discovery cohort was 41%. Therefore we calculated positive and negative predictive values of the cut-off point of <-0.29 as identified by the Youden index. the Youden Index (J), another main summary statistic of the ROC curve used in the interpretation and evaluation of a biomarker, which defines the maximum potential effectiveness of a biomarker. J can be formally defined as J = maxc {Se (c) + Sp (c) - 1}. The cut-point that achieves this maximum is referred to as the optimal cut-point (c*) because it is the cut-point that optimizes the biomarker's differentiating ability when equal weight is given to sensitivity and specificity. The Sensitivity was 77% and specificity 80% in the discovery cohort. The NPV in both the validation and discovery cohort remained high at 84 and 90%, outpreforming the FIB 4 with values of 66% and 78%.
|
| |
|
|
|
|
|