| |
Sex and Race Disparities in Mortality and Years of Potential Life Lost Among People With HIV: A 21-Year Observational Cohort Study
|
| |
| |
Download the PDF here
Jan 2023
Open Forum Infectious Diseases January 2023
Abstract
Background
Since the availability of antiretroviral therapy, mortality rates among people with HIV (PWH) have decreased; however, this does not quantify premature deaths among PWH, and disparities persist.
Methods
We examined all-cause and premature mortality among PWH receiving care at the Vanderbilt Comprehensive Care Clinic from January 1998 to December 2018. Mortality rates were compared by demographic and clinical factors, and adjusted incidence rate ratios (aIRRs) were calculated using multivariable Poisson regression. For individuals who died, age-adjusted years of potential life lost (aYPLL) per total person-years living with HIV were calculated from US sex-specific life tables, and sex and race differences were examined using multivariable linear regression.
Results
Among 6531 individuals (51% non-Hispanic [NH] White race, 40% NH Black race, 21% cis-gender women, 78% cis-gender men) included, 956 (14.6%) died. In adjusted analysis, PWH alive in the most recent calendar era (2014-2018) had decreased risk of mortality compared with those in the earliest calendar era (1998-2003; aIRR, 0.22; 95% CI, 0.17-0.29), and women had increased risk of death compared with men (aIRR, 1.31; 95% CI, 1.12-1.54).
Of those who died, Black women had the highest aYPLL (aIRR, 592.5; 95% CI, 588.4-596.6), followed by Black men (aIRR, 470.7; 95% CI, 468.4-472.9), White women (aIRR, 411.5; 95% CI, 405.6-417.4), then White men(aIRR, 308.6; 95% CI, 308.0-309.2). In adjusted models, higher YPLL remained associated with NH Black race and cis-gender women, regardless of HIV risk factor.
Conclusions
Despite marked improvement over time, sex disparities in mortality as well as sex and race disparities in YPLL remained among PWH in this cohort.
Figure 2. Age-adjusted years of potential life lost rates (95% CI) among individuals cared for at the VCCC who died during the study period (1998-2018), by (A) sex and race/ethnicity and (B) HIV acquisition risk factor. Abbreviations: aYPLL, age-adjusted years of potential life lost; MSM, men who have sex with men; VCCC, Vanderbilt Comprehensive Care Clinic
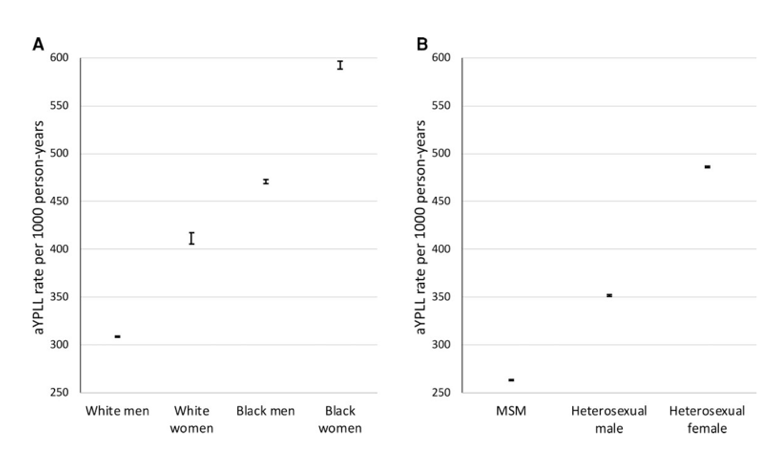
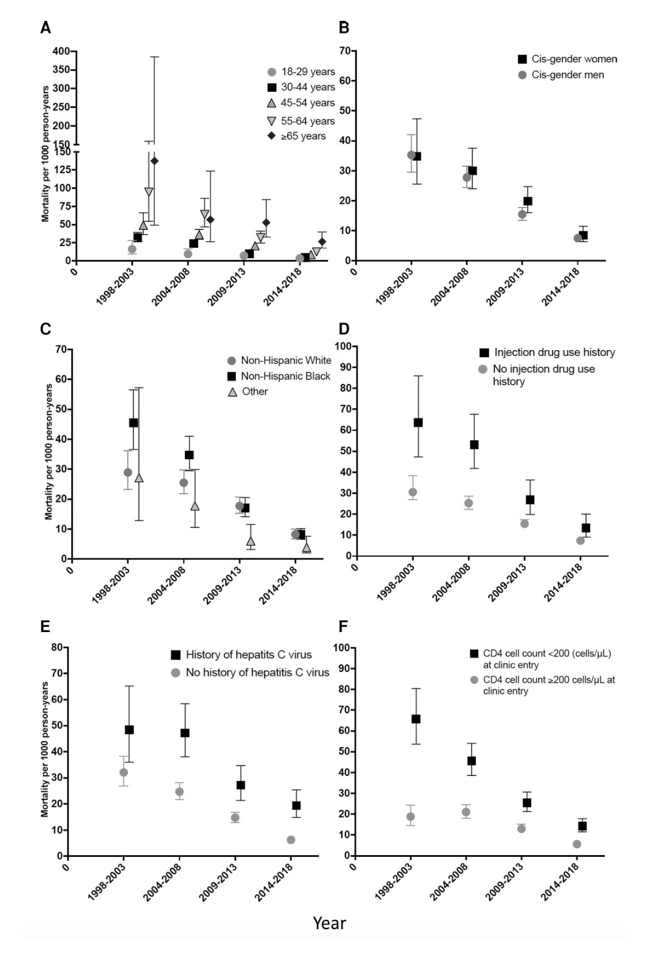
Figure 1. Unadjusted mortality rates by calendar era among individuals cared for at the VCCC, 1998-2018, by demographic and clinical characteristics, including (A) age during calendar era, (B) gender, (C) race/ethnicity, (D) history of injection drug use as HIV acquisition risk factor, (E) any history of hepatitis C virus infection, and (F) CD4 cell count at clinic entry. The 1998-2003 calendar era includes 1737 individuals, 4722.44 person-years, and 166 deaths. The 2004-2008 calendar era includes 3176 individuals, 11 044.57 person-years, and 313 deaths. The 2009-2013 calendar era includes 4285 individuals, 17 436.78 person-years, and 287 deaths. The 2014-2018 calendar era includes 5765 individuals, 24 313.98 person-years, and 190 deaths.
|
|
| |
| |
|
|
|